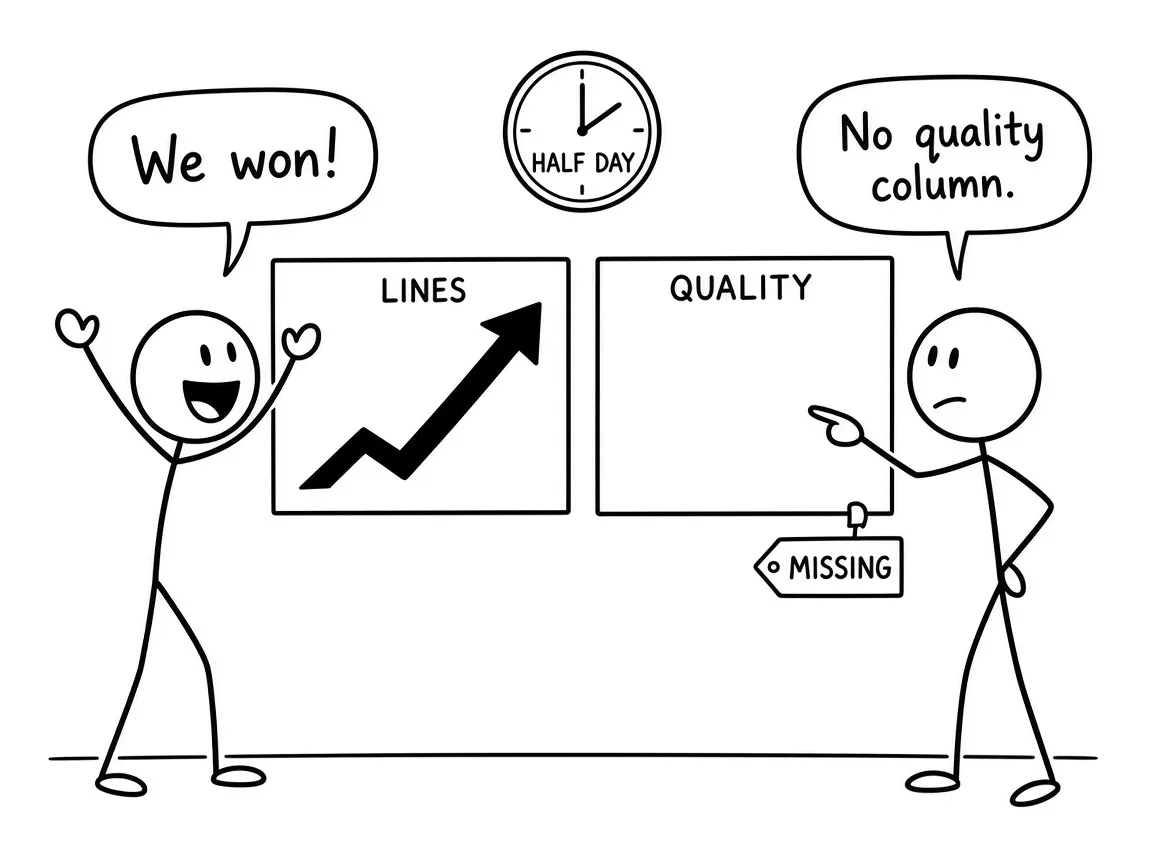
A morning table landed with a new agent harness. Lines per million tokens looked roughly twice the old run. Tokens per finished card looked cheaper. Cards per hour did not rise. There was no column for rework. The day was only half done.
Not from that table. That table is a scoreboard with the hard column left blank.
I keep seeing the same trap when people upgrade prompts, skills, or whole agent runtimes. Activity jumps. Someone calls it productivity. Greg Wilson puts the lines-of-code mistake plainly: more generated text is verbosity until you prove outcomes. Thoughtworks says the same about lines of AI-written code — look at delivery flow and stability, not the meter.
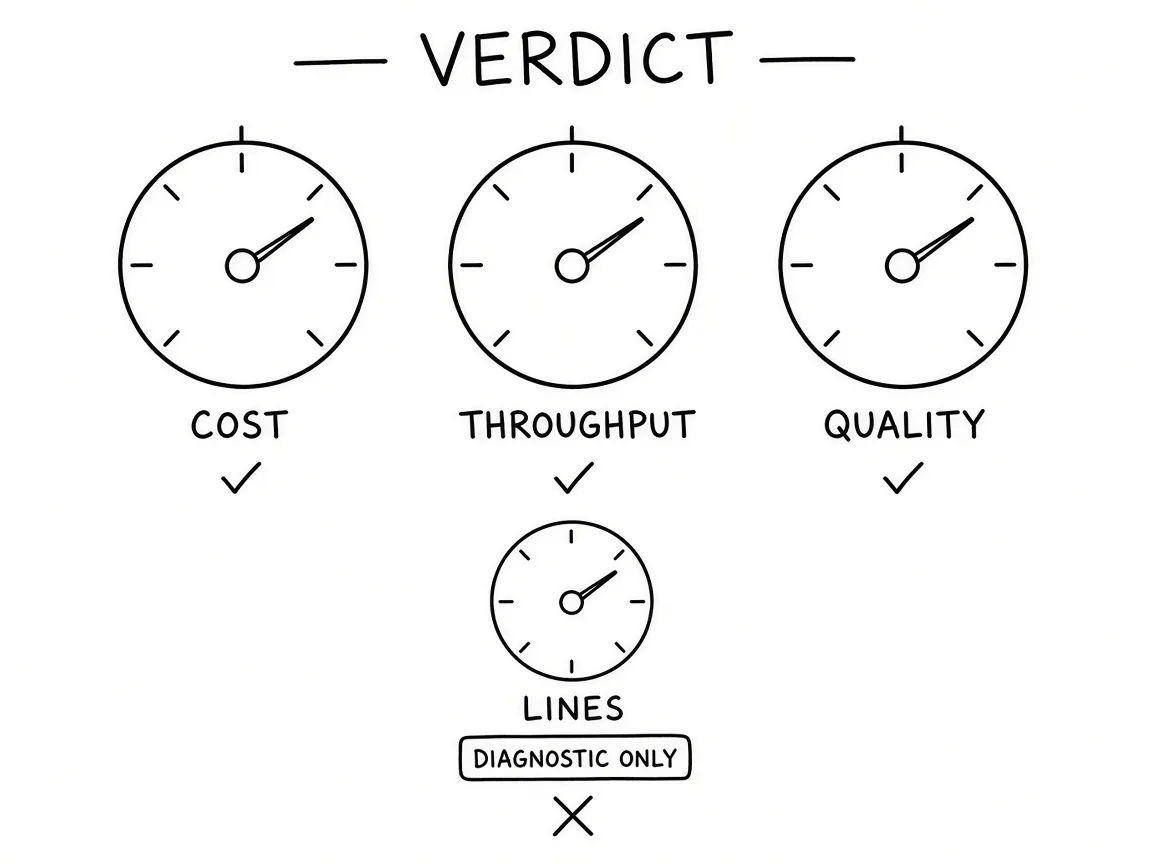
SPACE is the rule I trust here. Productivity is not one number. Satisfaction, performance, activity, communication, efficiency — pick at least three dimensions in tension. Activity alone is how you fool yourself. Lines stay in the diagnostic pile. They do not get a vote.
Cost matters. It is not enough by itself.
DX's AI measurement frame is utilization, impact, and cost. Cheap tokens that ship more reverts are not a win — you moved the bill to review and cleanup. DORA pairs throughput with instability for the same reason. Lead time and cards finished only count next to change-fail style signals. A harness that burns fewer tokens while REFUSE loops and post-merge fixes climb is not "more productive." It is faster at making work for humans.
GitLab walks through why suggestion-accept rates and line counts miss downstream cost. They cite GitClear-style churn: lines reverted or rewritten inside about two weeks. That window is the quality column the morning table forgot.
I already said the product fails when chrome replaces a gate. That matters here because a green activity chart is the same shape of lie.
Agents streaking across the frame, a slogan where a gate should be.
— from The operating-system claim: rare, useful, easy to fake
Same failure, different dashboard. Motion where a refuse path should sit.
Felt speed is the trap METR measured in the open.
Experienced open-source developers forecast about a twenty-four percent speedup with early-2025 AI tools. After the work, they still thought they were about twenty percent faster. The randomized timing said they were about nineteen percent slower. Sixteen developers. Real issues. That study is a snapshot of one era of tools — METR has newer follow-ups — and the lesson that travels is older than any model name: write the forecast before you look, and do not let the feeling set the story afterwards.
So for a harness upgrade I want the same discipline. Freeze the old run as a baseline you cannot keep editing. Exclude partial days. Exclude the novelty window when everyone is still excited. Pre-register what "better" means on cost, throughput, and quality. If the old system is gone and you cannot randomize against it, say the comparison is observational and keep the confounds named — card mix changed, tokens were already falling before the switch. Causal answers, if you still need them, come from toggles inside the new harness: tick interval, reset-after-refuse policy, how many cards run in parallel. One knob at a time.
That is a cost line, not a vibe.
Anthropic's Claude Code guidance keeps repeating the binding constraint: the context window fills, and quality falls as it fills. A scheduled tick that re-reads a fat session is a full model turn even when nothing changed. Measure idle tokens versus card-work tokens before you redesign anything. Adopt event-driven wakeups only if latency and missed signals stay honest. Responsiveness is not free. Price it.
When quality is not worse than the frozen baseline, and cost or throughput clears a threshold you wrote down before the window opened. Confirmed. If cost improves and quality or throughput slips, iterate on the named cause — over-building, serial dispatch, idle overhead — then open a new window. If quality slips and neither cost nor throughput improves, flag a regression and decide in the open. Do not sand it into the dashboard.
Lines per card can double because the cards got bigger, the tests got real, or the model padded. Split source versus test. Compare to the estimate. That explains the spike. It does not cast the verdict.
Good. Bring the rework column next time.